
Direct-to-consumer DNA tests such as 23andMe and AncestryDNA are becoming more and more popular. You may have seen advertisements, heard about them in conversation with friends and family members, and perhaps have even received a test as a gift. By the start of 2019, MIT Technology Review found that more than 26 million people had taken these types of tests, with more than 100 million people expected by 2021, bringing us to today. Direct-to-consumer genetic tests have made this field accessible to all, giving us insights into our ancestry, health, and traits, but what do they actually mean? What is the science behind them? How do you get from a swab of spit, to a report that not only provides an estimated composition of your ancestry, but even predicts your hair texture, or whether or not you have dimples (more on testing for traits in a future post)? Join us as we dive into the wonderful world of ancestry and find out!
Let’s start at the beginning. Your kit arrives at your door–what’s next? First, you’ll need to provide a sample of your DNA to be analyzed, but where does the DNA come from? Is it taken from a blood sample, or a hair with the root attached? The collection process is much simpler and requires no lab expertise. Simply fill a collection tube with your saliva and you’re on your way!
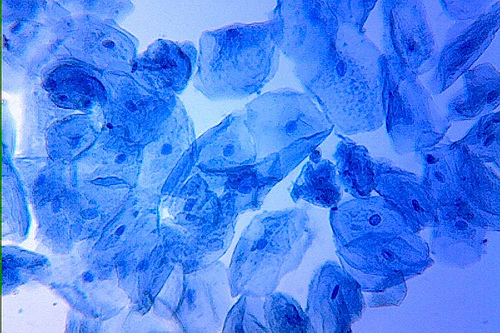
Photo Credit: Sciencesupply.com
Almost every single, teeny, tiny cell in your body contains a complete copy of your genome, or a complete set of the DNA instructions that make you, you! That includes the cheek cells you see here. Our saliva contains cells like these, as well as white blood cells, each teeming with DNA. The dark structures at the center of each of these cells are the nuclei. Each nucleus contains an entire set of your genetic information, 46 chromosomes made up of DNA (23 from each parent).
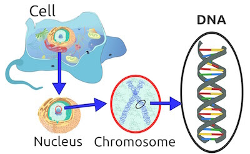
Photo credit: genetics.thetech.org
So how much DNA is that? To understand that, we need to crack the code. Your DNA instructions are composed of about 3.2 billion base pairs. In the image of DNA seen here, these base pairs are the colored rungs of the ladder. In other words, they are the A’s, T’s, C’s, and G’s that make up our code of instructions, referring to adenine, thymine, cytosine, and guanine, respectively. Vox uses a wonderful image of LEGO bricks to describe this in their video, “What DNA ancestry tests can-and can’t-tell you.”
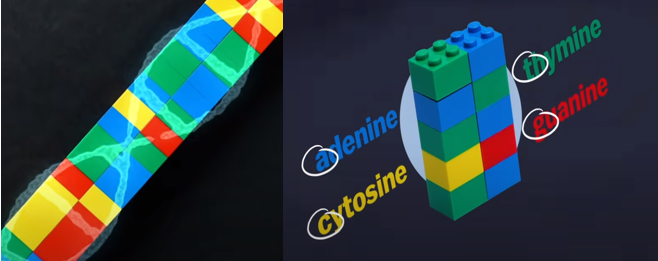
Photo Credit: Vox.com
However, these ancestry tests are not looking at all 3.2 billion pairs of letters that make up your genetic code. They are only looking at a tiny fraction of it. Part of this is because there would be a lot of repetition. Of these lines of code, 99.9% are identical in all humans. Just 0.1% of our DNA differs between individuals. For example, where I have a G, someone reading this might have an A. These differences, or variants, are known as SNPs (pronounced snips)–Single Nucleotide Polymorphisms. Ancestry tests look at collections of these SNPs, or areas in our DNA that are known to vary from one person to the next.
After analyzing our genotype (what bases we have–A, T, G, or C) at over half a million of these locations, it’s time to bring on the algorithms! Companies like AncestryDNA, or 23andMe, compare your set of SNPs to reference populations. In other words, parts of your DNA are compared to the DNA of people with known ancestries. For example, the 23andMe reference datasets include genotypes from 14,437 people. Most of these individuals are customers. According to 23andMe’s Ancestry Composition Guide, “when a 23andMe research participant <reports> they have four grandparents all born in the same country–and the population of that country didn’t experience massive migration in the last few hundred years, as happened throughout the Americas and in Australia, for example–that person becomes a candidate for inclusion in the reference data.” The rest come from public reference datasets, such as the Human Genome Diversity Project, HapMap, and the 1000 Genomes Project, or other researchers.
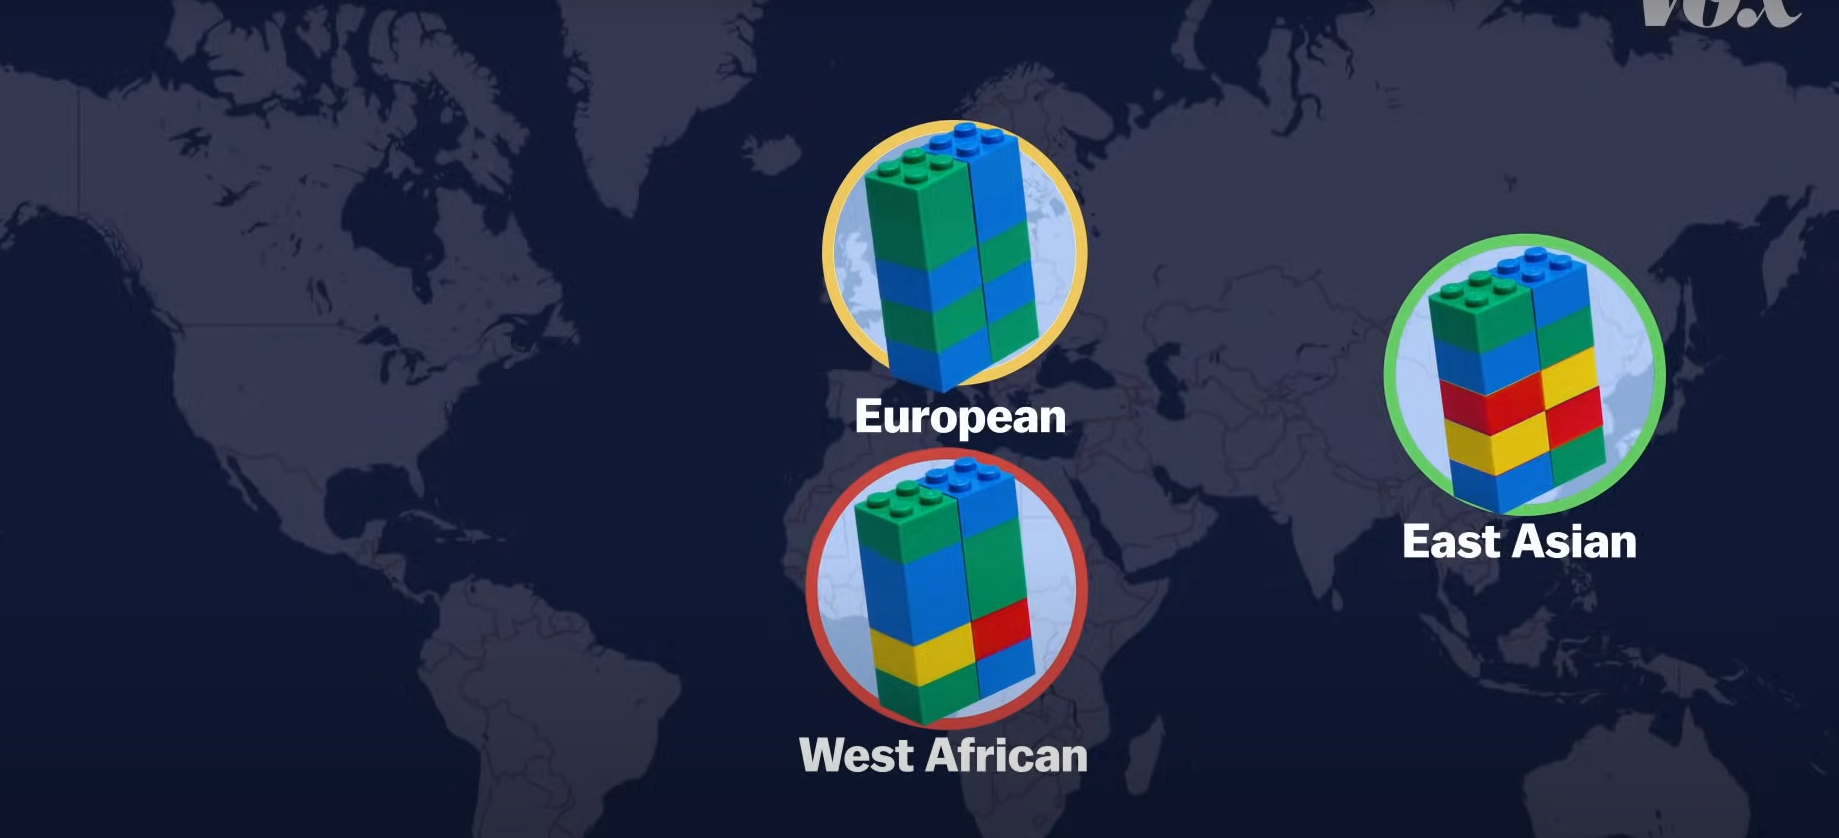
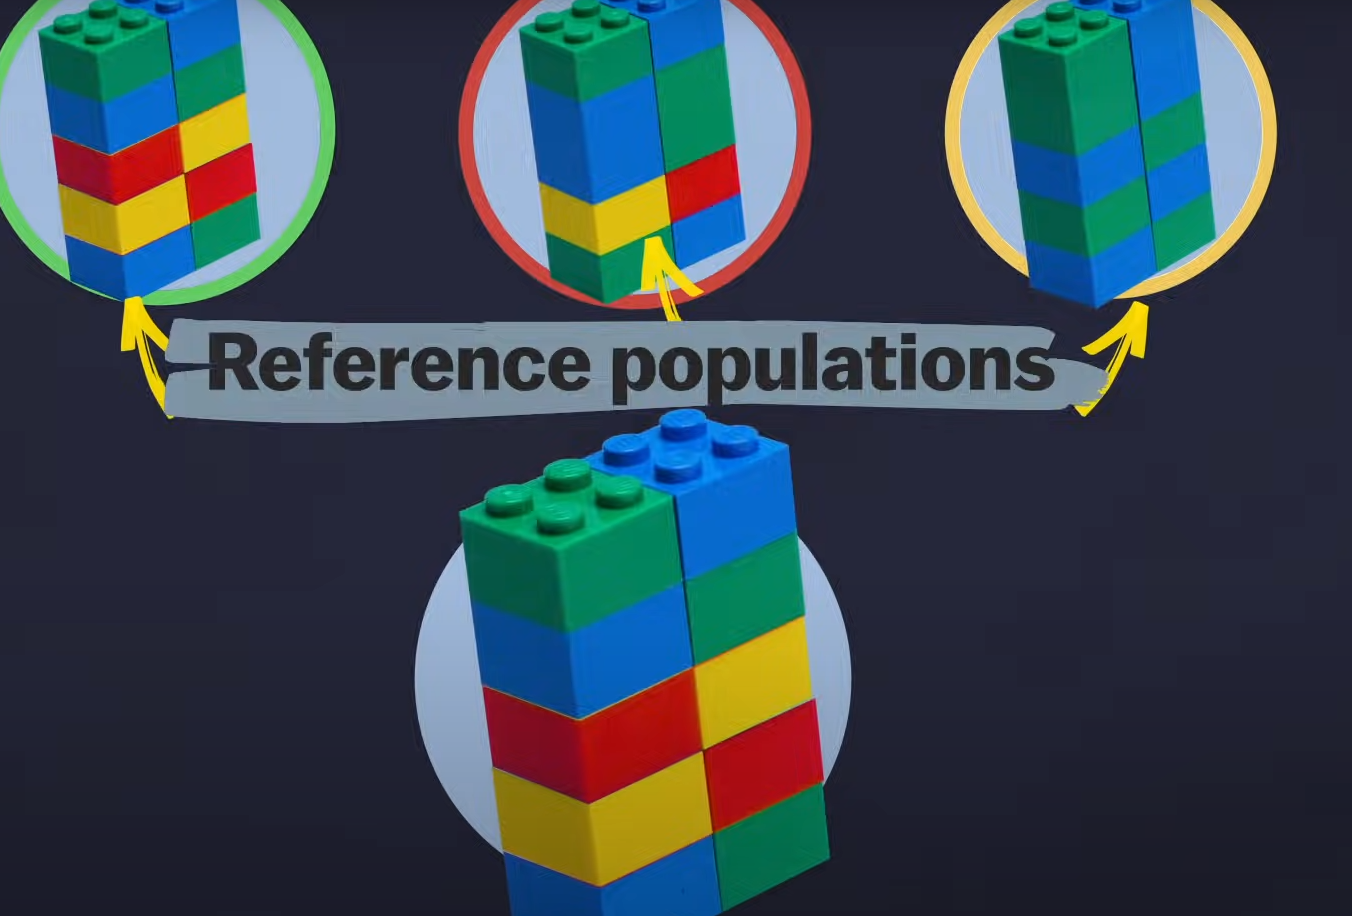
Photo Credit: Vox.com
After these comparisons are made, you get an estimated ancestry composition with percentages. So, let’s say my results (more on that in a future post) are 50% Italian. That does not mean that 50% of my DNA comes from Italy. It means that of the spots the test looked at, 50% of my SNPs are associated with people in the company’s reference population from Italy. It is a probability with a margin of error. That word is important here–probability. These tests are not infallible.
Firstly, certain differences in our DNA can be found in multiple populations around the world. For example, the same SNP can be found in Mexico, Chile, or even China. How can a test be sure where you inherited that particular piece of DNA from? There can also be small errors in the actual genotyping process, before you even get to the algorithm. While these errors are few and far between, they can add up to noticeable differences.
However, a big thing to keep in mind here is this idea of a reference population, or the set of data to which your results are being compared. These reference populations are not all the same, which is why individuals can get different results from different testing companies. It is also why really small percentages can be less meaningful. These percentages could be based on a single person in a reference population who, if reclassified, can cause that number to change. These datasets are also not as diverse as they need to be. Genetics research has overwhelmingly focused on people of white, European ancestry. An estimated 80% of participants in genome-wide association studies are of European ancestry, despite only making up a fraction of the world’s population. This has significant implications for the future of healthcare and areas like precision medicine, which hopes that treatment plans can one day be tailored to an individual’s genetic makeup. This is the basis for the National Institutes of Health’s program All of Us, which invites one million people across the country to become a part of one of the most diverse health databases in history.
Some ancestry testing companies like 23andMe are addressing these biases head-on, and making initiatives to be more inclusive. Their Ancestry Composition Guide states, “historically, biomedical research has disproportionately focused on participants of European descent. Due to this bias, and to the fact that a large proportion of 23andMe customers have European ancestry, we have the most reference data from European populations, and we are able to distinguish as many subpopulations from Europe as across all of Asia.” In light of this, they are working to combat inequities in genetics research and have initiated projects like the Global Genetics Project and the African Genetics Project.
All in all, direct-to-consumer ancestry tests can be a wonderful introduction into the field of genetics. Not only do participants explore their own DNA and history, but just by testing, each individual contributes to a database of information that is invaluable for scientific research, and which needs to be broadened and diversified. Knowing how these tests work and what they are actually measuring can help us to understand what they can, and can’t tell us. Keep an eye out for future posts on this topic as we continue to explore!
Things to keep in mind:
- As we have seen time and time again, humans cannot be neatly classified into groups based on our genetic variation, and looking at populations as having stark differences can reinforce misconceptions about race and genetics.
- Health information obtained through direct-to-consumer DNA tests is not diagnostic, and any concerns should be reviewed with a genetic counselor.