
You may be noticing that the days are starting to get shorter as the weather begins to cool and the leaves begin to change. While they have technically been shortening since the solstice, which fell on June 20 this year, we often don’t notice the change until this time of year. As a massive summer fan, the loss of daylight is usually a huge bummer for me personally. One way that I have found to help cope with this is by making some data-collection lemonade out of the day-shortening lemons.
Tracking what is going on around you is a great way to get more in touch with the cycles of our Earth. The patterns of Earth can work on a slow scale, but tracking changes over a long time helps reveal these secrets. One thing you can track right from home is the amount of daylight your town receives each day.
Collecting and Graphing Your Data
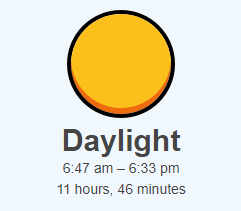 There are many resources you can use to find this data. I personally like timeanddate.com, but feel free to look around and find something that suits you! If you click the link, it will take you to the day data for Hartford, but you can input your own city or town. You will find a graphic that looks like the one on the right showing the amount of daylight we had today. Scrolling down will reveal records of the amount of daylight for previous days.
Now that you have started to collect your data, we have to record it in a way we can interpret! I like using graphs for this type of data. Below is an example of a graph you could make to record your daylight information.
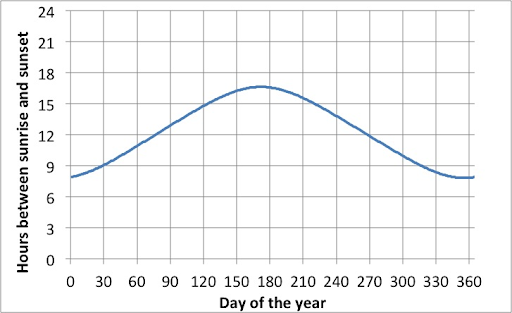 On the x-axis, or horizontal axis, you’ll find the number of the days. Instead of recording the days in the ‘month/day’ convention we are typically used to, I numbered them 1-365, but you can do whatever works best for you! On the y-axis, or vertical axis, you’ll find the amount of daylight that we received that day. Once you input a couple of days, you should start to see some patterns forming.
Analyzing Your Data
Graphs are great tools for being able to visualize lots of data and see larger trends and patterns.
Once you start to examine your graph, ask yourself questions!
- Do you see a pattern or is your data random?
- If you see a pattern, does it happen quickly or slowly? Is it repeated?
- Are there any points on your graph that seem out of place?
Now remember, our graph is telling us something about the amount of daylight we receive. Start to think about the patterns you noticed in your graph in terms of this.
- When are your days the longest or shortest? Does this make sense with what you see outside?
- If you noticed patterns, how many days or months do these patterns take place over? Does this make sense?
- Using what you notice, can you predict what might happen in the month to come? What about this time next year?
The Science
So what’s going on here? Why are we getting less sunlight now? The change in the length of our days is all about the tilt of the Earth. Our Earth does not revolve around the Sun with the North Pole pointed straight up and the South Pole pointed straight down. We actually revolve with a 23.5° tilt. If you enjoy the beautiful seasons we have here in New England, you have that 23.5° tilt to thank!
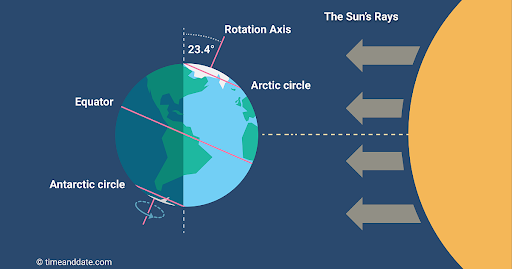
Take a look at the image below. The pink line going through the North and South Poles is called the axis. It has the 23.5° tilt we mentioned earlier. If you look closely, you’ll see that as our Earth revolves around the Sun, that tilt does not change. During the June solstice, the North Pole is pointed toward the Sun, while during the December solstice, the South Pole is pointed toward the Sun.
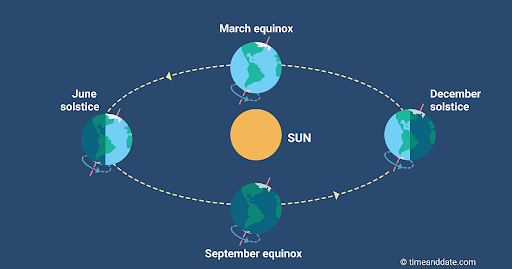
Here in Connecticut, we are in the Northern Hemisphere (the half of the Earth closer to the North Pole). This means that during times close to the June solstice, when the North Pole is pointed toward the Sun, the Northern Hemisphere receives more sunlight. If you look at the image below, you can see quite clearly how much more sunlight the Northern Hemisphere is receiving compared to the Southern Hemisphere. This is when we receive the most sunlight and have the longest days of our year. On the flip side, if you were in the Southern Hemisphere, let’s say in Australia, you would be experiencing the shortest day of the year.
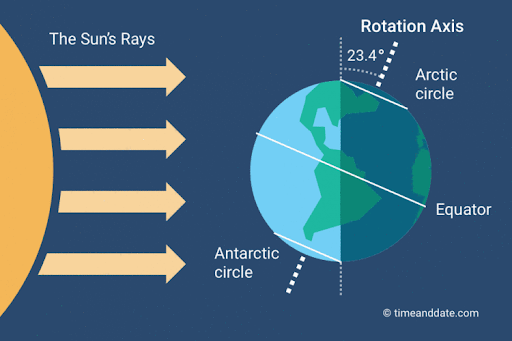
Now let’s jump 6 months to the December solstice, which is our shortest day of the year. Like we said before, during the December solstice, the South Pole is pointed toward the Sun which means the North Pole is pointed away. Look at the image below. Can you see how little sunlight the Northern Hemisphere is receiving now? This is when we experience our shortest day of the year. If you were in Australia (in the Southern Hemisphere), it would be the longest day of the year for you!
So what does all of this mean for us? Well, in addition to shortening or lengthening our days, the difference in received sunlight gives us our seasons! When the Northern Hemisphere is tilted away from the Sun and we receive less sunlight, the temperature drops and we experience all of the things that make a New England winter so spectacular. When we are tilted toward the Sun and receive more direct sunlight, the temperature in Connecticut is higher and we experience summer!
We are incredibly lucky to live in a place with four distinct and beautiful seasons. Because of its position, the Equator receives about the same amount of sunlight every single day which means the seasonal temperature doesn’t vary very much. While I often find myself wishing I lived at the Equator during February, I try to remind myself that I get to experience such a diversity of weather thanks to my geographical position on our globe. Next time you stand in awe of a giant snowstorm, or marvel at the new life of spring, take a moment to thank that 23.5° tilt.
This program was made possible in part by the Institute of Museum and Library Services.
We want to see what you try at home. Share your graphs, observations and experiments with us online by using the hashtag #ScienceAtPlay and tagging @CTScienceCenter.

Aoife Ryle is a STEM Educator at the Connecticut Science Center. In addition to working with school groups, she works with our Teen Program, Overnights department, and shoots weekly science segments for WFSB. She has a degree in Bioengineering from the University of Maine and has a personal interest in the life sciences and engineering which makes bioengineering a perfect crossover.