

As a former high school science teacher, I can attest to the fact that it is difficult to remember the specific lessons I taught, the order I taught them, and the key takeaways from each. My plan book was my best friend. A student was absent? Check the plan book. Support staff wants to know the objective of last Tuesday’s learning activity for your first period class? The plan book. Administration curious how the lesson fits into your sequence or learning events for your 6th period? The plan book. Get what I am saying? Check the plan book! This brings to mind an interesting point, if we lean on our plan books to keep our thoughts straight over time, what do students lean on? They are trying to connect learning progressions, relying on these pieces to make up a whole, whether it be for an assessment or to explain a phenomenon. If I work best by referring back to one location where I can see what we’ve done, why wouldn’t my students?
This leads us to the idea of summary tables. What is a summary table? How can I use one? How can my students’ use one? Why are they helpful?
Let’s start with why are they helpful, as I have already started to talk about this a little bit. A summary table can be used as a road map for a teacher and as a journal for a student. A summary table developed prior to the unit unfolding can assure cohesion for a teacher and help to assign focus to the work. Creating one as activities unfold will help the students take ownership of their activities and allow them to make meaning of them rather than being told why the lessons help to build upon the unit.
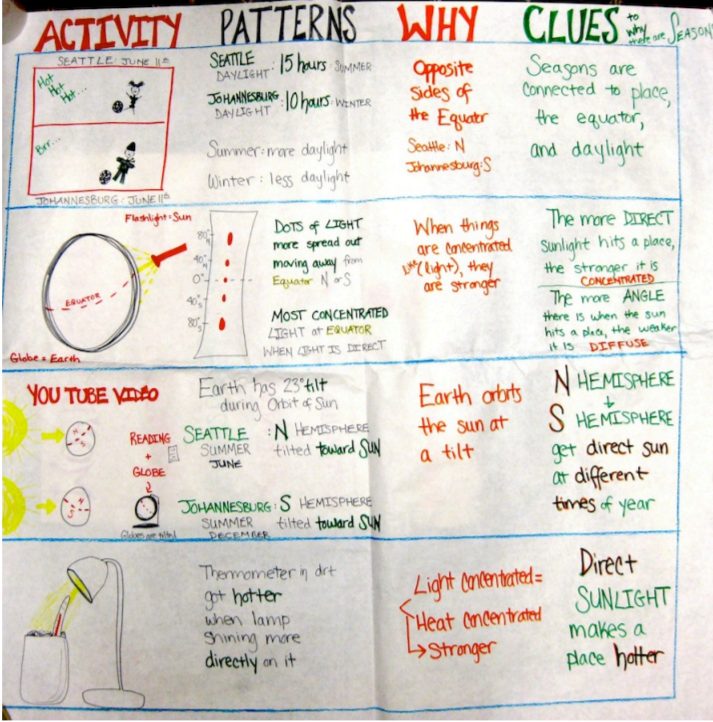 This leads us to one of our other questions or what is a summary table? We’ve already talked about how they are a road map and journal all at once, how can that be? A summary table is a visual representation of how learning activities link together to explain the big picture or phenomena. They are often seen as a table with 3-5 columns and 4-5 rows so as to avoid being overwhelming or nitpicky. The four columns help to explain the different parts of the activities and the rows indicate the different lessons or activities. There is not one way to set up a summary table, however a few aspects ring true. 1) Stick to the major activities, don’t belabor the table as it can feel redundant and tedious like a chore. 2) Let the students drive what goes into their summary tables – especially if they’re doing individual ones. 3) Have a common summary table prominently displayed in the classroom or use a digital version; it can be a very helpful learning tool to allow students to glance at along the way. 4) Refer to the summary table throughout the unit, don’t wait until the end to fill it out or discuss it with the students.
And finally how can I and my students use one? I touched upon these two components a bit earlier, but let’s talk about it a little more in depth. A teacher’s summary table should look very similar to a students, but might be even more in depth. When you’re designing your unit, or refreshing yourself on a unit prior to teaching it, fill out a summary table. Include the activities that lead into explaining the phenomenon, explain how the activity links back to the phenomenon, include questions you want your students to be able to answer, and think about how this lesson will lead into the next. Feel free to include links to resources or pages for you to reference when referring back to your plan. A students version could have the same categories, but it should be written in student facing language (ie. they are the ones filling it out). This will help you to make sure your students are getting out of the activities what you intended them to. If they aren’t connecting the dots, it might be helpful to add in another activity or allow the students to diverge from the plan a bit! For more information, check out the resources we shared a few weeks back about Making Student Thinking Visible or Duelling with Science’s step by step guide to designing and using Summary Tables.
This content was made possible in part by the Institute of Museum and Library Services.
Thank you for taking the time to read this blog post! The team at the Mandell Academy is here to support your needs, and are always happy to share what we find with you. For more resources, join our Educator Hub on Facebook and search our Professional Learning opportunities on our website.

Lindsey Sullivan is a Professional Learning Specialist at the Connecticut Science Center’s Mandell Academy for Teachers. Before joining the Mandell Academy, Lindsey was a high school science teacher. Currently, Lindsey supports educators as they make sense of NGSS through her facilitation of workshops offered by the Mandell Academy as well as providing coaching support in schools.